For most pitchers the breaking ball below the zone but high enough for the hitter to be tempted to swing is by far the best pitch in a 0-2 or 1-2 count. I discuss why this is in my book as well as other posts here but I think that this has always been an accepted part of baseball theory both before and after the introduction of analytics to the game.
The more interesting question comes from the fact that most pitchers have only one breaking pitch, and given that there are two strikes, often will have used that pitch on the pitch before. This brings up a conundrum for the catcher - is it really best to call the same pitch, probably in the same location since you usually don't want to throw a breaking ball for a strike when there are two already, twice in a row? We will turn to a study of breaking pitch performance, based on the type and location of the previous pitch and current pitch, for the answer.
Measuring the Performance of One Pitch
To accurately gauge the performance of a given type of pitch in a given count we must account not only for the performance of that pitch when the ball was put into play but also the gain or loss to the pitcher when the count changes on a taken ball (or strike if there are not two already, which does not apply here). We use the same framework as discussed in this post, with an added wrinkle that the estimated wOBA from any given count is now estimated from regression equations based on the ultimate wOBA outcome of the plate appearance versus the pre-season Steamer wOBA projection across all MLB hitters in that count.
For the relevant counts to this discussion these equations are the following:
0-2 : 0.0175 + 0.606 * Steamer wOBA
1-2 : 0.0590 + 0.554 * Steamer wOBA
2-2: 0.1079 + 0.553 * Steamer wOBA
For example, suppose the count is 1-2 and the hitter had a pre-season Steamer wOBA of 0.400. Based on these equations we would predict the hitter's expected wOBA for this plate appearance, starting from 1-2, to be 0.059 + 0.554*0.400 = 0.2806. If the hitter took a ball to go to 2-2, his new wOBA would then be predicted to be 0.1079 + 0.553*0.400 = 0.3291, a gain of 0.0485 from the pitch before. If the hitter made an out on the 1-2 pitch (wOBA of 0) he would suffer a loss of 0 - 0.2806 = -0.2806. And if the hitter hit a single (wOBA value 0.7) he would gain 0.7000 - 0.2806 = 0.4194. Across all MLB pitches in each count the league-wide average pitch will have a value of 0. A positive value indicates a hitter-favoring pitch compared to before, while a negative value indicates a pitcher-favoring pitch.
The Impact of the Last Pitch on Well-Executed Pitches
We start by looking at the absolute best pitches, which we define as curveballs, sliders, and knuckle curves, thrown in a box starting at least 0.5 feet above the ground up to 0.2 feet above the bottom of the strike zone, and no more than 1.2 feet in either x-direction from the center of the plate. These are high-quality pitches which averaged a -0.038 wOBA compared to other pitches in that count. We start by looking at how these pitches performed based on whether the previous pitch was of the same pitchfx pitch type:
|
Performance of "Good" Breaking Balls, 0-2, 1-2, and 2-2
|
|
| wOBA Gained | |
| All Pitches | -0.038 |
| Same as Last Pitch | -0.025 |
| Same as Second to Last Pitch | -0.031 |
| Different from Last Pitch and Second to Last Pitch | -0.047 |
When the pitch before and the pitch before that were not breaking balls, a breaking ball thrown in this "good area" performs either 0.016 or 0.022 wOBA points better than if either pitch was a breaking ball. Over this sample of 12.8k pitches this is a large enough impact to conclude that there is a legitimate influence not caused by luck alone.
We can take things further by using a regression predicting wOBA allowed by the characteristics of the pitch thrown. Pitchers with better breaking balls use them more often. This means that the true impact of repeating pitches in the sequence is likely to be higher than our last estimate because when a pitcher used their breaking ball twice or more in a row in the above sample, they were likely a pitcher with an above-average breaking ball, which makes the repeated breaking ball average look better than it would be otherwise. At the same time we can also compare the speed of the current breaking pitch to the last pitch to see if there are any timing-based effects.
|
Factors Influencing Performance of "Good" Breaking Balls in 0-2, 1-2, and 2-2 Counts, After Controlling for Location, wOBA Gained/Lost
|
|
| Z-Movement in Feet (down = negative) | 0.0176 |
| Difference in MPH Between Last Pitch and Current Pitch | 0.00127 |
| Speed in MPH of the Current Pitch | -0.0034 |
| Same Pitch as Before | 0.0299 |
| Same Pitch as Two Pitches Before | 0.0222 |
| Same Pitch as Both the Last Pitch and Two Pitches Before | 0.0079 |
As we would expect, breaking balls with more movement perform better when thrown in this area - the coefficient of 0.0176 implies a 0.0176 lower wOBA per foot of vertical drop. A faster pitch performs better as well at -0.0034 points lower per MPH thrown. Interestingly, it is better if the last pitch was slower than faster relative to the current pitch: for each 1 MPH faster the last pitch was compared to the current one, the next pitch will perform 0.00127 wOBA points worse.
Finally, we see that after accounting for pitch characteristics, the pitcher would suffer a 0.0299 wOBA point penalty for throwing the same pitch twice in a row and a 0.0222 wOBA point penalty for throwing the same pitch as two pitches ago. But if he throws the same pitch three times in a row, while we would expect the penalty to be 0.0299 + 0.0222 or 0.0521 since he is throwing the same pitch as before and two pitches ago, instead it is only 0.0079 or 0.0430 wOBA lower than we would expect.
It is hard to explain the "three in a row" lack of penalty but perhaps the hitters are just surprised, perhaps it is variance, or perhaps a pitcher who is willing to throw the same pitch three times in a row is very confident in the pitch for reasons that aren't fully captured in the stats. Either way, the wOBA penalties for showing the same breaking pitch one or more times in a row are significant. As for why these penalties exist, it is just as one would expect - hitters don't swing as often when they see a chase pitch twice in a row. If the last pitch was the same they swing 12.7% less often, other things being equal, if the next to last pitch was the same they swing 4.5% less often, and if the last two pitches were the same they swing 5.7% less often.
Despite these penalties, if the pitcher can execute their breaking ball well by putting it in the chase area, they will still almost always have the advantage over the hitter, as the histogram of expected wOBA across all breaking pitches in this area suggests:
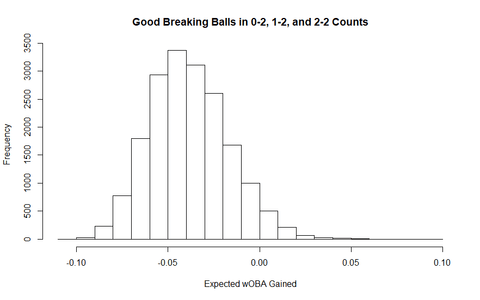
Nearly all breaking pitches thrown in the chase zone in these counts have predicted wOBA gained values well below 0, indicating a pitcher-favoring pitch, although there is a fat tail of what are likely very poor pitches (slow, no break, edges of the "good" area, used back-to-back) in the positive range. In general, if you are completely confident in your pitcher's ability to locate their breaking ball well, you can call it every single time and expect to come out far ahead.
The Sequencing Impact to Breaking Balls Thrown in Other Locations
Of course, pitching would be easy if the pitcher could locate their breaking ball in a small box just below the zone every time. In reality only about 30% of breaking balls thrown in these pitcher's counts are thrown in the optimal "chase" area. The other 70% do not perform nearly as well:
|
Performance of Breaking Balls by Location, 0-2, 1-2, and 2-2
|
|
| All Pitches | -0.007 |
| Located in Chase Area | -0.038 |
| Located Elsewhere | 0.006 |
When worse-located pitches are included, the breaking ball in these counts is not as dominant, although it still is better than other types of pitches given its average wOBA of -0.007 compared to the overall average of 0. We can break down the performance of breaking balls based on the last two pitches and location:
|
Performance of Breaking Balls by Location, 0-2, 1-2, and 2-2
|
||||
| All | Last Pitch Same | 2nd Last Same | Neither Same | |
| All Pitches | -0.007 | 0.001 | -0.008 | -0.010 |
| Located in Chase Area | -0.038 | -0.025 | -0.031 | -0.047 |
| Located Elsewhere | 0.006 | 0.012 | 0.003 | 0.006 |
Breaking balls thrown outside of the chase area are not as influenced by the last two pitches as those thrown in the chase area. Hitters performed 0.006 wOBA better against "bad" breaking balls if the last pitch was the same, but performed nearly identically if the last pitch was the same as two pitches ago. Across all pitches, the overall impact is that throwing the same breaking ball back to back is about 0.010 wOBA points worse than in other situations. This reduced impact aligns with pitch tunneling theory. When thrown in the chase location, a hitter may misidentify the breaking ball as a fastball thrown for a strike for a split second since both start in a similar location. When this happens the hitter must swing given the count dictating the hitter defend the plate. But for pitches thrown outside this area, there is no such effect, as regardless of whether the hitter identifies the pitch as a breaking ball or fastball, if it starts way above or outside the zone, there is no temptation to swing.
As before, we can perform the same regression of all breaking balls adjusted for pitch quality, and find that across all locations and adjusting for pitch quality, the penalty for throwing a back-to-back breaking ball is 0.015 wOBA, the penalty for throwing the same pitch as two pitches before is 0.006 wOBA, and the penalty for throwing the same pitch three times in a row is almost exactly nil, rather than the 0.021 wOBA we would have expected.
Should Pitchers Throw Back-to-Back?
While breaking balls are better than other pitches in the pitcher's counts, a penalty of 0.015 wOBA is large enough to overcome the inherent superiority of breaking balls being 0.007 wOBA points better than the average pitch. This would suggest that if a pitcher does not have an strong breaking ball relative to their other pitches, they should avoid throwing it back-to-back. And as the penalty is higher for breaking pitches thrown in the best locations, even pitchers with good breaking ball command may want to avoid throwing it back to back. However, the best alternative to throwing a breaking ball back to back is usually a fastball in or above the zone, which is a slightly below-average pitch in these counts for most pitchers. This means that even accounting for the penalty it is very close, and most pitchers would not be making a big mistake throwing breaking balls in the dirt over and over in every two strike situation, only mixing in the occasional fastball to keep hitters honest.
If a pitcher has a nasty breaking ball, or very good command such that they can consistently locate the pitch in the chase area right below the plate, they can easily do well enough with the pitch to overcome the 0.015+ wOBA penalty for back to back pitches, because good breaking balls are way better than any other pitch when there are two strikes. Even if the hitter has seen it before, an MLB-level breaking ball in a good location is hard to lay off, and the mathematics of the situation dictate that the hitter swing and the pitcher try to induce a chase.