Not all of the increase in offense over the past few years has been due to juiced balls, seam heights, or some other type of conspiracy like undetectable steroids or illegal bats. With all the new training techniques in the game hitters are also hitting smarter as well. Perhaps this has slightly outpaced advances in pitching technique over the same time period.
Hitting the ball harder and higher is hard, and requires extensive training given that most MLB players are close to optimal already. One area of slightly lower-hanging fruit is changing one's approach. The 0-0 count has long been a missed opportunity for hitters. Compared to the first pitch, hitters only see more fastballs and strikes in obvious hitter's counts. Despite this, the hitter only swings 29% of the time, less often than any count other than 3-0:
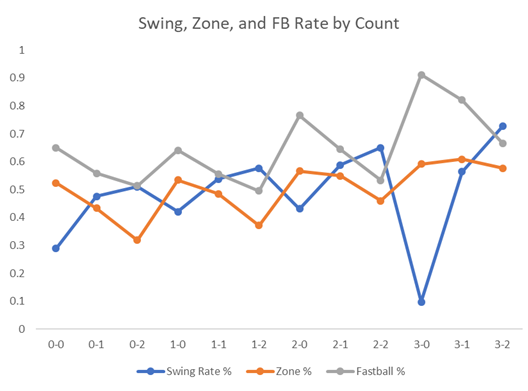
By definition 0-0 is the ultimate neutral count, and there should be no obvious bias toward taking pitches, compared to when the hitter is ahead in the count and they have the ability to take ball four, or when they are behind in the count and need to swing to avoid the strikeout. In fact knowing that the pitcher is likely to throw a fastball, and it is likely to be in the zone, yet there is no risk of swinging at ball four, it would seem that 0-0 should be a situation where hitters should be more aggressive than usual.
Comparing 0-0 to 3-1: An Inefficiency
Using this framework that measures the change in hitter wOBA expectation after each pitch we can show that hitters are not swinging enough 0-0, are swinging too much later in the count, or both. Let's compare the 0-0 count, where hitters swung 29.0% of the time between 2016 and 2019, to the 3-1 count, where hitters swung 56.4% of the time:
| Count | wOBA Gained or Lost, All Batter Swings | wOBA Gained or Lost, Pitch is in Zone | wOBA Gained or Lost, Batter Swings at Pitch in Zone | Average Distance from Center of Zone when Batter Swings in Feet |
| 0-0 | -0.005 | -0.019 | 0.006 | 0.779 |
| 3-1 | -0.071 | -0.061 | -0.063 | 0.722 |
Across every count, when the batter swings, their expectation will be worse than when they take. There are very few hitters capable of doing enough damage with a swing for that outcome to be better than taking an additional ball. This does not mean swinging is wrong, as when the hitter swings, the pitch usually would have been a strike, and therefore the hitter often does better by swinging than taking against that pitch. Knowing this, while hitters lost -0.005 wOBA compared to the start of the PA when swinging in 0-0 counts, this is far more favorable to the hitter than swinging in the 3-1 count, and in fact, is far more favorable for the hitter than any other count. Across all counts, hitters do best when they swing in 0-0 relative to taking, which suggests they may not swing enough.
The key item of comparison is between the third and fourth columns. When the pitcher throws their 0-0 pitch in the zone they can expect to reduce the hitter's expected wOBA by 0.019 on average, but when the hitter decides to swing at this pitch, their outcome is 0.006 better than when they started for a net gain of 0.025 over average and about 0.056 over taking. Compare this to the 3-1 count, where the hitter actually does worse (-0.063) when they swing at the pitch in the zone than when they take the pitch (-0.060). That is, the way hitters approach 3-1 now, it is better for the batter, even knowing the pitch is in the zone, to take what is very likely to be a strike and go to 3-2 than it is to swing. This doesn't even account for the times the hitters accidentally swing at ball four, the biggest mistake in hitting by far. And this is despite the fact that when hitters swing 3-1, the pitch is closer to the dead center of the zone than in 0-0 counts, indicating it is a far more hittable pitch on average. Yet hitters swing twice as often in 3-1 compared to 0-0.
Have teams done the math themselves and started to catch on to this trend, becoming more aggressive on the first pitch? The evidence suggests that they have:
| Year | Swing Rate | Zone % | wOBA Gained, All Pitches | wOBA Gained, Batter Swings |
| 2015 | 28.8% | 52.4% | -0.0014 | -0.01 |
| 2016 | 28.3% | 52.5% | 0.0001 | -0.0054 |
| 2017 | 28.6% | 52.6% | 0.0002 | -0.0048 |
| 2018 | 28.9% | 52.7% | -0.0008 | -0.0084 |
| 2019 | 30.0% | 51.8% | 0.0021 | 0.0007 |
In 2019 hitters attacked the first pitch 1.1% more often, despite facing 0.9% fewer pitches in the official strike zone. While swinging more against fewer strikes should almost always be bad, the imbalance of strategy in 0-0 counts up to 2019 was so extreme that hitters actually improved their outcome as a result, by 0.0030 wOBA. As insignificant as this sounds from a gambling or even strategic perspective, keep in mind that every plate appearance has a first pitch and there are around 78 plate appearances in an average game. 0.003*78 = 0.234, so using a scale of Runs to wOBA of 1.15 we can calculate the run impact per game to be .234 / 1.15 or 0.20 runs per game due to this single trend.
Of course, some of this may have been due to seam height/juiced balls or better hitting talent relative to pitching talent, rather than the superiority of a more aggressive approach. Digging deeper we see that indeed at least part of the gains were due to simply hitting the ball better when the hitter decided to swing:
| wOBA Gained, Pitch was in Zone | wOBA Gained, Batter Swings at Pitch in Zone | Average Distance from Center of Zone when Batter Swings, in Feet | Percentage of Time Batter Swings when Pitch is in Zone | wOBA Gained, Pitch not in Zone |
| -0.0214 | 0.0008 | 0.79 | 41.3% | 0.0205 |
| -0.0197 | 0.0054 | 0.79 | 40.7% | 0.0222 |
| -0.0197 | 0.0067 | 0.78 | 41.6% | 0.0223 |
| -0.0217 | 0.0035 | 0.77 | 42.2% | 0.0223 |
| -0.0166 | 0.0146 | 0.77 | 43.5% | 0.0220 |
When the hitter swung at a pitch in the zone in 2019, they averaged a wOBA gain of 0.0146, or 0.0111 higher than they did in 2018. This is despite swinging at slightly more pitches overall. But the increased aggression did not seem to influence the average quality of pitch hitters swung at, as at 0.77 feet from the dead center of the zone it was the same distance as the previous year. In short, hitters just got better at hitting against the same pitches in 2019 versus 2018 and even had their swing rate been the same, they would have improved their outcome in this count by 0.002 wOBA. The other 0.001 wOBA of improvement was due to taking fewer pitches for strikes due to swinging 1% more often as well as facing fewer strikes. Interesting is that this more aggressive approach did not significantly hurt hitters on balls thrown out of the zone, as their performance against these pitches was only 0.0003 worse.
Swinging at the first pitch more often was basically "free money" for teams in 2019, as they got better against everything with no real downside. As for why it happened, it is possible that some of these teams ran the numbers and started a pro-swing movement. Also possible is that hitters subconsciously realized that since the ball carries super well now, they might try swinging more early on to put it over the fence before giving these nasty Rhapsodo pitch design cyborg pitchers a two strike count with which to put them away.
Swing Rate-Gaining Teams in 2019 Beat their Projections
Which teams upped their swing rate the most in 2019, and how much did they gain?
|
Year over Year Change in 0-0 Hitting Stats, 2019 vs. 2018
|
|||||||
| Year | Team | Swing Rate Increase | Swing Rate (2019 Only) | wOBA Gained | % of Pitches in Zone | % of Pitches within 0.6 feet of Dead Center | Average Preseason Steamer Hitter wOBA Projection |
| 2019 | NYN | 6.62% | 35.7% | 0.005 | -1.84% | -1.56% | 0.002 |
| 2019 | MIN | 6.61% | 31.8% | 0.016 | -3.80% | -1.88% | 0.007 |
| 2019 | PIT | 5.04% | 34.6% | 0.008 | -2.44% | -0.38% | -0.003 |
| 2019 | MIA | 3.25% | 29.4% | 0.001 | -1.67% | -0.10% | -0.004 |
| 2019 | BOS | 2.85% | 30.0% | 0.005 | 0.90% | -0.08% | 0.002 |
| 2019 | NYA | 2.69% | 30.3% | 0.010 | 0.61% | 1.05% | -0.014 |
| 2019 | SFN | 2.62% | 31.7% | 0.009 | -2.53% | -1.79% | -0.007 |
| 2019 | CLE | 2.54% | 27.8% | 0.000 | 0.27% | 1.57% | -0.005 |
| 2019 | LAN | 2.30% | 27.4% | 0.000 | -1.74% | -0.03% | 0.003 |
| 2019 | SEA | 1.93% | 29.2% | 0.001 | 0.74% | -0.27% | -0.011 |
| 2019 | PHI | 1.74% | 30.4% | 0.003 | -1.89% | -0.41% | 0.007 |
| 2019 | TOR | 1.60% | 30.1% | 0.000 | 0.43% | 1.00% | 0.000 |
| 2019 | SLN | 1.35% | 30.2% | 0.002 | -0.35% | 0.29% | 0.005 |
| 2019 | SDN | 1.13% | 30.5% | 0.006 | -2.38% | -1.66% | 0.011 |
| 2019 | ARI | 0.90% | 29.4% | 0.010 | -2.82% | 0.07% | -0.008 |
| 2019 | COL | 0.43% | 32.8% | 0.003 | -2.19% | -1.10% | -0.001 |
| 2019 | TEX | 0.38% | 27.1% | -0.001 | 1.94% | 2.08% | -0.007 |
| 2019 | KCA | 0.37% | 31.4% | 0.004 | 0.79% | 0.62% | 0.002 |
| 2019 | HOU | 0.17% | 29.2% | -0.001 | 2.38% | 1.32% | -0.002 |
| 2019 | OAK | 0.01% | 27.4% | 0.000 | -1.18% | 0.20% | 0.002 |
| 2019 | BAL | -0.02% | 29.9% | -0.002 | -0.55% | 0.55% | -0.018 |
| 2019 | DET | -0.21% | 30.3% | 0.000 | 1.08% | 1.41% | 0.003 |
| 2019 | CHA | -0.48% | 29.5% | 0.002 | -2.44% | 0.38% | 0.003 |
| 2019 | CIN | -0.93% | 31.8% | 0.003 | -2.10% | -2.15% | 0.010 |
| 2019 | CHN | -1.40% | 31.2% | 0.003 | -2.83% | -0.64% | -0.002 |
| 2019 | MIL | -1.60% | 26.7% | 0.004 | -2.99% | -1.35% | 0.009 |
| 2019 | ATL | -1.63% | 33.1% | 0.001 | -0.70% | 0.26% | 0.013 |
| 2019 | WAS | -1.68% | 28.2% | -0.001 | -0.88% | 1.90% | 0.006 |
| 2019 | TBA | -1.77% | 30.5% | -0.006 | 1.47% | 1.46% | 0.014 |
| 2019 | ANA | -3.36% | 22.6% | 0.003 | -1.03% | 0.48% | 0.003 |
The Mets, Twins, Pirates, Marlins, and Red Sox were the top five gainers in 0-0 swing rate and four out of these five improved their 0-0 results by more than the league average improvement of 0.0029. The Twins and Pirates were perhaps most notable, as the Twins, despite fielding hitters that would only be expected to be 0.007 wOBA better per plate appearance, gained 0.014 wOBA just from the first pitch alone, while the Pirates gained 0.008 wOBA on the first pitch despite fielding what were projected to be worse hitters.
Notable across these top teams is that they faced fewer strikes, on average 1.8% less than the year before, yet took 4.8% more swings. This would seem to indicate an active effort on the part of these teams to attack the first pitch more rather than just getting more pitches worth swinging at. While one could argue that they were lucky to see fewer strikes and that drove their improvement, game theory-wise, if pitchers know a team is more aggressive than usual, they may change their pitching approach as a result, targeting more near the edges of the plate and throwing fewer strikes. In this way the hitters will benefit from their increased swing rate without having to actually do better when they swing. Finally, the improvement of these teams did not come from seeing more "meatballs", defined here as being within 0.6 feet of the dead center of the plate, as these teams actually saw fewer such pitches than the league average. So we have a case of real improvement, most likely due to doing things better rather than better players.
To see if teams who increased their swing rate improved their 0-0 results in other years, I ran a regression of year over year difference in 0-0 wOBA outcome versus game year, year over year difference in swing rate, Zone % faced, and Steamer preseason wOBA, for each of the last four seasons. Steamer preseason wOBA change did not have any significant influence on 0-0 improvement, while the regression predicted an improvement of 0.00050 wOBA points per 1% increase in swing rate, and -0.00064 wOBA points per 1% increase in Zone % faced. Other things being equal, a team who swings 10% more often in the 0-0 count would be expected to improve their wOBA by 0.005, not an insignificant change on a single pitch.
The betting implications of this metric are honestly somewhat small. Betting on the top 5 teams in 0-0 swing rate increase over each of the last 5 years would have lost 35 units over ~4860 games (slightly less in reality because you wouldn't bet one qualifier against another and I double-counted those), a -0.7% ROI, and would have done worse last year as the Red Sox got destroyed. To be fair, that is still 1.7% better than betting at random, and we are talking about a baseball stat that is only analyzing one aspect of one pitch in one half of the game. Where this sort of thing can be more valuable is in daily fantasy or fantasy baseball when analyzing the performance of hitters who have seen a big spike in production. Often it is just luck, but sometimes these hitters are doing something different than before that is making them a truly better hitter.